Bitcoin's Next Price Frontier: Why It's Surging and What Comes Next
There’s a fascinating paradox unfolding right now, one that speaks volumes about the future we’re building. Bitcoin, the digital asset that has been declared dead more times than a comic book hero, is sitting near its all-time high. You’d expect the conversation to be about overheating, about a bubble ready to burst. But if you listen closely, if you look at the right data, the sound you hear isn’t a frantic roar. It’s a quiet, powerful hum.
The metrics, the deep structural indicators we use to take the temperature of this network, are telling us something that defies intuition: Bitcoin is "ice cold." How can an asset be at its peak and simultaneously be nowhere near its limit? What does it mean for a system to be running at full power, yet showing no signs of strain? This isn't just another market cycle. I believe we are witnessing the maturation of a new kind of economic machine, one whose next moves are becoming startlingly clear if you know how to read the blueprints.
The New Oracle: When Code Predicts the Future
Let’s start with the immediate horizon, because the numbers themselves are staggering. A new empirical model, one built by analyst Timothy Peterson, is drawing a bold line in the sand. Using an AI-based simulation that crunches a decade of historical data, the model points to a 50% probability that Bitcoin will cross the $140,000 mark before the end of this October. Think about that. Not a wild guess shouted on social media, but a statistical projection from a model that learns from the past to map the future, an idea explored in depth by the Bitcoin Short-Term Prediction: Why The Price Will Cross $140,000 By The End Of October.
This isn’t just a random shot in the dark; it’s rooted in observable patterns. October has historically been one of Bitcoin’s strongest months, a recurring seasonal tide that lifts all boats. Peterson’s analysis even pinpoints specific days—the 9th, the 20th, the 28th—that have been bullish over 71% of the time since 2015. The speed and precision of this data-driven forecasting is just mind-boggling—it means the gap between statistical probability and market reality is closing faster than we can fully process, turning abstract models into tangible roadmaps for the immediate future.
When I first saw the charts, I honestly just sat back in my chair for a moment. We're moving past the era of reading tea leaves and into an age of economic cartography. These models aren't magic; they are the logical output of a system built on pure, unadulterated mathematics. But if a machine-learning model can project a 15% surge with this degree of confidence, what does that tell us about the underlying asset? Does it suggest that Bitcoin’s infamous volatility is not chaos, but a complex pattern we are only now beginning to understand?
Beyond the Hype: An Engine Running Cool
A short-term prediction, however compelling, is just one snapshot in time. What truly gets my pulse racing is a deeper, more fundamental signal coming from the network’s core. It’s a metric called the Mayer Multiple, and it provides one of the most elegant ways to gauge market sentiment.
The Mayer Multiple is essentially a simple ratio—in simpler terms, it measures how "hot" or "cold" Bitcoin's price is relative to its own long-term 200-week moving average. Historically, when this multiple climbs above 2.4, it signals that the market is overextended, euphoric, and likely due for a correction. It’s the engine’s red line. Right now, with Bitcoin hovering around $120,000, the Mayer Multiple is at a placid 1.16. That’s not just cool; it’s closer to its "oversold" territory than its "overbought" peak.
Imagine a revolutionary new engine that can propel a vehicle to 300 miles per hour without even breaking a sweat, without the chassis vibrating or the temperature gauge moving an inch. That’s what we’re seeing here. For the Mayer Multiple to even reach that historical "overbought" level of 2.4, Bitcoin’s price would need to climb to around $180,000. This data suggests that the current all-time high isn’t the ceiling; it’s a new foundational floor being laid for the next phase of growth, a conclusion echoed in reports like Bitcoin Mayer Multiple: BTC price can hit $180K before being ‘overbought’.
This reminds me so much of the early days of the internet. I remember the endless stream of articles in the late 90s dismissing it as a niche for hobbyists, a fad that would never achieve mainstream adoption. The skeptics saw a clunky, slow technology, but those of us looking at the data—at the exponential growth in nodes, at Metcalfe's law in action—saw the blueprint for the future of communication. We're seeing the same pattern recognition failure today. People see a volatile price and shout "bubble," while the underlying metrics are calmly indicating that the real journey has barely begun.
Of course, with this kind of paradigm-shifting technology comes immense responsibility. We’re not just talking about a stock or a commodity; we’re talking about the potential rails for a new global financial system. As we build it, we have to ask ourselves: how do we ensure this system is equitable, accessible, and resilient? The code provides the foundation, but we, the people, must provide the conscience.
The long-term models support this vision of steady, powerful growth. Peterson’s cyclical analysis, which tracks Bitcoin’s movement within a consistent upward channel since 2022, projects a potential path toward $200,000 within the next six months. This isn’t wishful thinking. It’s an observation of a repeating pattern, a market cycle that has proven remarkably consistent through booms and busts.
The Math is the Map
What we are witnessing is the slow, undeniable transition of Bitcoin from a speculative asset into a predictable, protocol-driven economic organism. The noise and volatility that have defined its first decade are the growing pains of a system finding its global equilibrium. But underneath that noise, a clear, mathematical signal is emerging. It tells us that the current price, far from being a peak, is merely a waypoint on a much longer journey. The models aren't just predicting the future anymore; they are revealing a reality that has been encoded in the system from the very beginning. The math is the map, and it’s pointing directly upward.

-
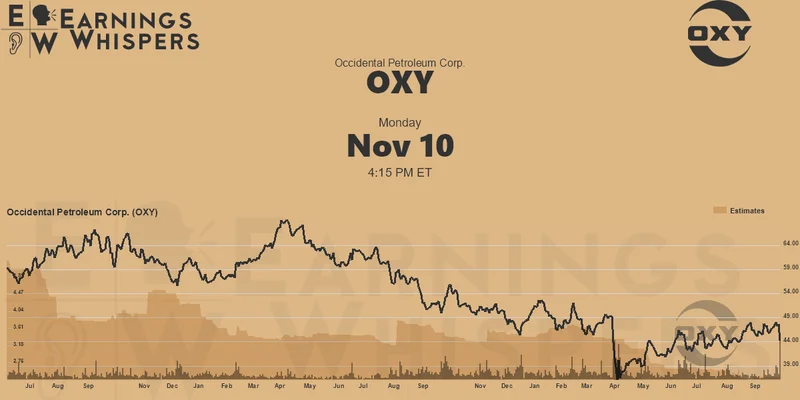
Warren Buffett's OXY Stock Play: The Latest Drama, Buffett's Angle, and Why You Shouldn't Believe the Hype
Solet'sgetthisstraight.Occide...
-

The Great Up-Leveling: What's Happening Now and How We Step Up
Haveyoueverfeltlikeyou'redri...
-

The Future of Auto Parts: How to Find Any Part Instantly and What Comes Next
Walkintoany`autoparts`store—a...
-

Applied Digital (APLD) Stock: Analyzing the Surge, Analyst Targets, and Its Real Valuation
AppliedDigital'sParabolicRise:...
-
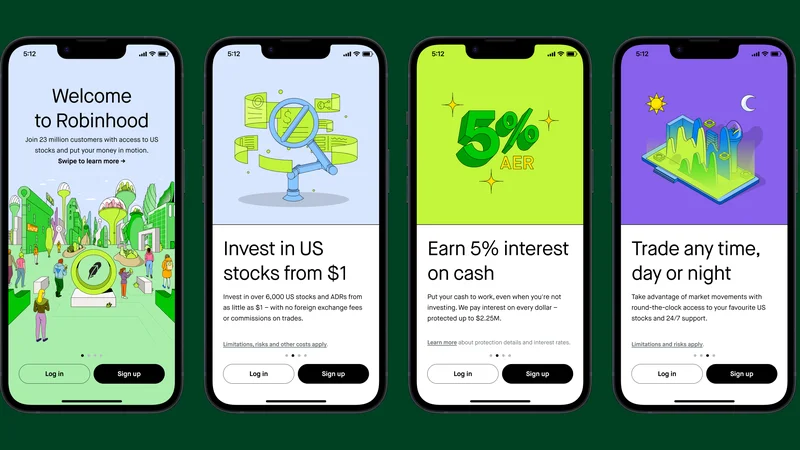
Analyzing Robinhood: What the New Gold Card Means for its 2025 Stock Price
Robinhood's$123BillionBet:IsT...
- Search
- Recently Published
-
- DeFi Token Performance & Investor Trends Post-October Crash: what they won't tell you about investors and the bleak 2025 ahead
- Render: What it *really* is, the tech-bro hype, and that token's dubious 'value'
- APLD Stock: What's *Actually* Fueling This "Big Move"?
- Avici: The Real Meaning, Those Songs, and the 'Hell' We Ignore
- Uber Ride Demand: Cost Analysis vs. Thanksgiving Deals
- Stock Market Rollercoaster: AI Fears vs. Rate Hike Panic
- Bitcoin: The Price, The Spin, & My Take
- Asia: Its Regions, Countries, & Why Your Mental Map is Wrong
- Retirement Age: A Paradigm Shift for Your Future
- Starknet: What it is, its tokenomics, and current valuation
- Tag list
-
- Blockchain (11)
- Decentralization (5)
- Smart Contracts (4)
- Cryptocurrency (26)
- DeFi (5)
- Bitcoin (31)
- Trump (5)
- Ethereum (8)
- Pudgy Penguins (6)
- NFT (5)
- Solana (5)
- cryptocurrency (6)
- bitcoin (7)
- Plasma (5)
- Zcash (12)
- Aster (10)
- nbis stock (5)
- iren stock (5)
- crypto (7)
- ZKsync (5)
- irs stimulus checks 2025 (6)
- pi (6)
- hims stock (4)
- kimberly clark (5)
- uae (5)