Gold Price: Today's price per ounce and what the data signals
The screen flickers. December gold is up $37.10, punching through the psychologically significant $4,000-an-ounce barrier to settle at $4,009.10. Silver is riding shotgun, posting its own sharp gains. For anyone watching the market on October 10, 2025, the data presents a sharp, almost violent, contradiction. Just hours before, the short-term technical charts were screaming "sell." Indicators were flashing red, momentum was negative, and the prevailing wisdom was to short any rally.
And yet, the price went up.
This isn't just a story about a volatile trading day for the `price of gold`. It's a clinical case study in the growing chasm between short-term noise and long-term signal. On one side, you have the algorithm-driven world of intraday chart patterns; on the other, the slow, tectonic shifts of global geopolitics and central bank policy. That Friday, the two collided, and the fundamentals didn't even flinch.
The Seductive Logic of a Bear Trap
Let's first examine the case for the bears, because on paper, it looked perfectly sound. An analyst from LKP Securities, looking at the Indian MCX futures market, laid out a clear case for why a ‘Sell on rise’ strategy makes sense. The numbers were compelling. Gold had just fallen from a high near ₹1,23,800 to ₹1,20,500. The short-term 8-day exponential moving average had crossed below the 21-day EMA (a classic bearish signal), and prices were hugging the lower Bollinger Band, indicating strong downward momentum.
The indicators were even more explicit. The Relative Strength Index (RSI) was hovering around 27. For the uninitiated, anything below 30 is considered "oversold," which can sometimes signal an impending bounce. But here, combined with other data, it was interpreted as a sign of profound weakness. The MACD histogram bars were expanding negatively, confirming selling pressure. It was a textbook setup for a continued slide, with targets set as low as ₹1,19,100.

I've looked at hundreds of these technical reports, and this one was, by the book, a solid piece of analysis. It was logical, data-supported, and precise. It was also completely wrong about the market's direction that day. Why? Because the entire thesis was built on looking through a microscope when the real action was happening at a telescopic distance. The problem with relying on purely technical indicators in this environment is that they are reactive. They measure the market's recent past, not the powerful undercurrents shaping its future. What does an "oversold" RSI truly mean when sovereign nations are acting as systematic, non-price-sensitive buyers in the physical market?
The Geopolitical Tectonic Plate
While day traders were dissecting hourly charts, nation-states were moving bullion. The real story behind the `gold price today` wasn't in the EMA crossover; it was in the balance sheets of the National Bank of Poland and the People's Bank of China. According to ING, central banks were on track to purchase over 1,000 tonnes of gold for the third consecutive year. This trend is a key reason why ING forecasts average gold price of $4,150 per ounce in 2026 amid central bank buy. This wasn't portfolio diversification. This was a coordinated, strategic shift away from the U.S. dollar as the primary reserve asset. The pace of this buying had doubled since the conflict in Ukraine began, a clear indicator of its geopolitical nature. China had been buying for eleven straight months. Poland announced plans to increase its gold holdings to 30% of total reserves.
This is the part of the data that I find genuinely telling. The actions of a central bank aren't a trade; they're a policy statement. They aren't trying to scalp a few points on the COMEX. They are hedging against systemic risk and de-dollarizing their economies. This creates a massive, structural bid under the market that intraday indicators simply aren't designed to capture.
This fundamental support was supercharged by a cocktail of global instability. On that same day, U.S.-China trade tensions were ratcheting up, with China levying new fees on U.S. ships and opening an antitrust probe into Qualcomm. In Washington, the U.S. government shutdown was entering its second week, paralyzing key economic data releases. Meanwhile, the U.S. Treasury was intervening directly in currency markets, offering a $20 billion lifeline to Argentina to prop up the peso—a move that, while intended to project strength, also hints at growing instability in emerging markets and the lengths required to maintain the dollar-centric system. All of this chaos funnels capital toward the one asset that sits outside any single government's control. The `gold spot price` wasn't rallying in a vacuum; it was reacting to a world that felt increasingly fragile.
Don't Mistake the Tremors for the Tectonic Shift
So, what's the real takeaway from October 10, 2025? It’s that we are in a market where the old playbooks are becoming obsolete. The whipsaw volatility that scared traders is not a sign of a topping market; it's the friction generated by a massive, underlying repricing. The short-term bearish technical signals were the tremors. The sustained central bank buying and escalating geopolitical risk are the tectonic shift. Relying on the former while ignoring the latter is like trying to predict an earthquake by watching a glass of water ripple. The data is clear: the fundamental case for gold isn't just intact, it's accelerating. The day-to-day price action is just noise distracting from that core fact.

-
Warren Buffett's OXY Stock Play: The Latest Drama, Buffett's Angle, and Why You Shouldn't Believe the Hype
Solet'sgetthisstraight.Occide...
-

The Great Up-Leveling: What's Happening Now and How We Step Up
Haveyoueverfeltlikeyou'redri...
-

The Future of Auto Parts: How to Find Any Part Instantly and What Comes Next
Walkintoany`autoparts`store—a...
-

Applied Digital (APLD) Stock: Analyzing the Surge, Analyst Targets, and Its Real Valuation
AppliedDigital'sParabolicRise:...
-
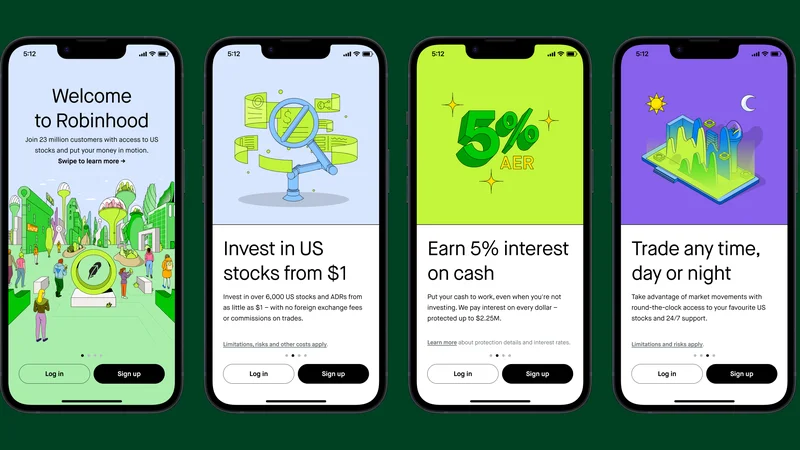
Analyzing Robinhood: What the New Gold Card Means for its 2025 Stock Price
Robinhood's$123BillionBet:IsT...
- Search
- Recently Published
-
- DeFi Token Performance & Investor Trends Post-October Crash: what they won't tell you about investors and the bleak 2025 ahead
- Render: What it *really* is, the tech-bro hype, and that token's dubious 'value'
- APLD Stock: What's *Actually* Fueling This "Big Move"?
- Avici: The Real Meaning, Those Songs, and the 'Hell' We Ignore
- Uber Ride Demand: Cost Analysis vs. Thanksgiving Deals
- Stock Market Rollercoaster: AI Fears vs. Rate Hike Panic
- Bitcoin: The Price, The Spin, & My Take
- Asia: Its Regions, Countries, & Why Your Mental Map is Wrong
- Retirement Age: A Paradigm Shift for Your Future
- Starknet: What it is, its tokenomics, and current valuation
- Tag list
-
- Blockchain (11)
- Decentralization (5)
- Smart Contracts (4)
- Cryptocurrency (26)
- DeFi (5)
- Bitcoin (31)
- Trump (5)
- Ethereum (8)
- Pudgy Penguins (6)
- NFT (5)
- Solana (5)
- cryptocurrency (6)
- bitcoin (7)
- Plasma (5)
- Zcash (12)
- Aster (10)
- nbis stock (5)
- iren stock (5)
- crypto (7)
- ZKsync (5)
- irs stimulus checks 2025 (6)
- pi (6)
- hims stock (4)
- kimberly clark (5)
- uae (5)